How can welding processes be optimized with Big Data and sources of error eliminated?Weldloop: Usage of Advanced Data Integration Uncovers New Optimization Potentials
VITRONIC's Weldloop software integrates weld inspection data with process data from the welding line. This makes it easier to identify causes of defective seams and optimize welding processes. The latest version of the solution has been enhanced with additional evaluations, visualizations and tools. They make it easier to analyze data and eliminate the sources of defects - and save valuable time in production.
Optimizing welding processes to avoid scrap
In the production of body parts or axles for vehicles, every single weld seam must be inspected: there can be no compromises when it comes to safety. Automated inspection systems use image processing to reliably find all defects and document the inspection results. The non-OK parts are rejected and reworked.
Every welding defect costs unnecessary time and money. Vehicle manufacturers have to work efficiently. Detecting defective parts before delivery is not enough. The aim must be to avoid defects and rejects from the outset if possible - by quickly finding and eliminating sources of error. In this way, welding processes can be made progressively more stable and reliable.
Linking inspection data and process data
Without context, however, the data from the visual inspection do not allow direct conclusions to be drawn about the causes of defects. Such analyses still depend largely on the experience of welding engineers: they set out to find the fault, change the welding parameters and thus try to eliminate it. This can take time. Meanwhile, the welding line is often at a standstill. In addition, this method prevents continuous automation of the line.
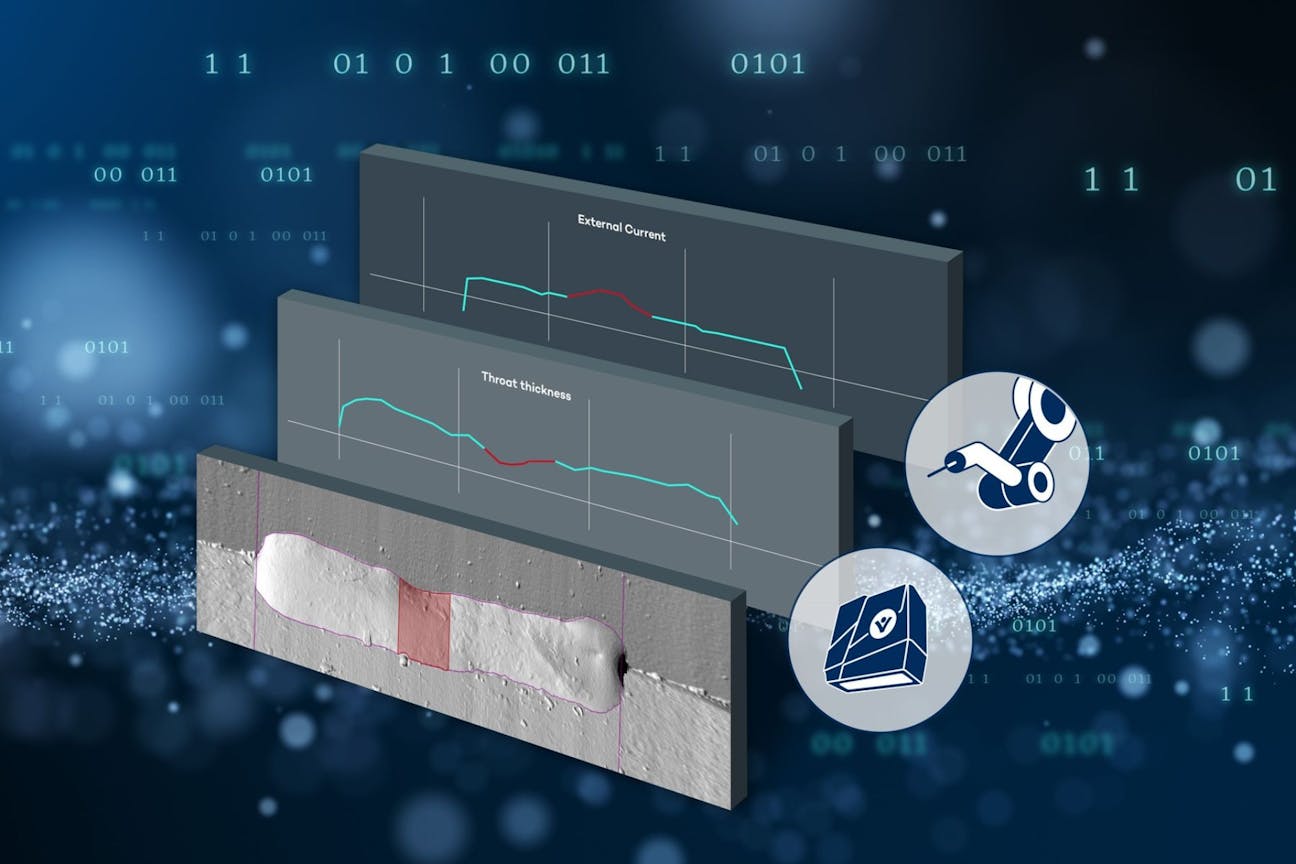
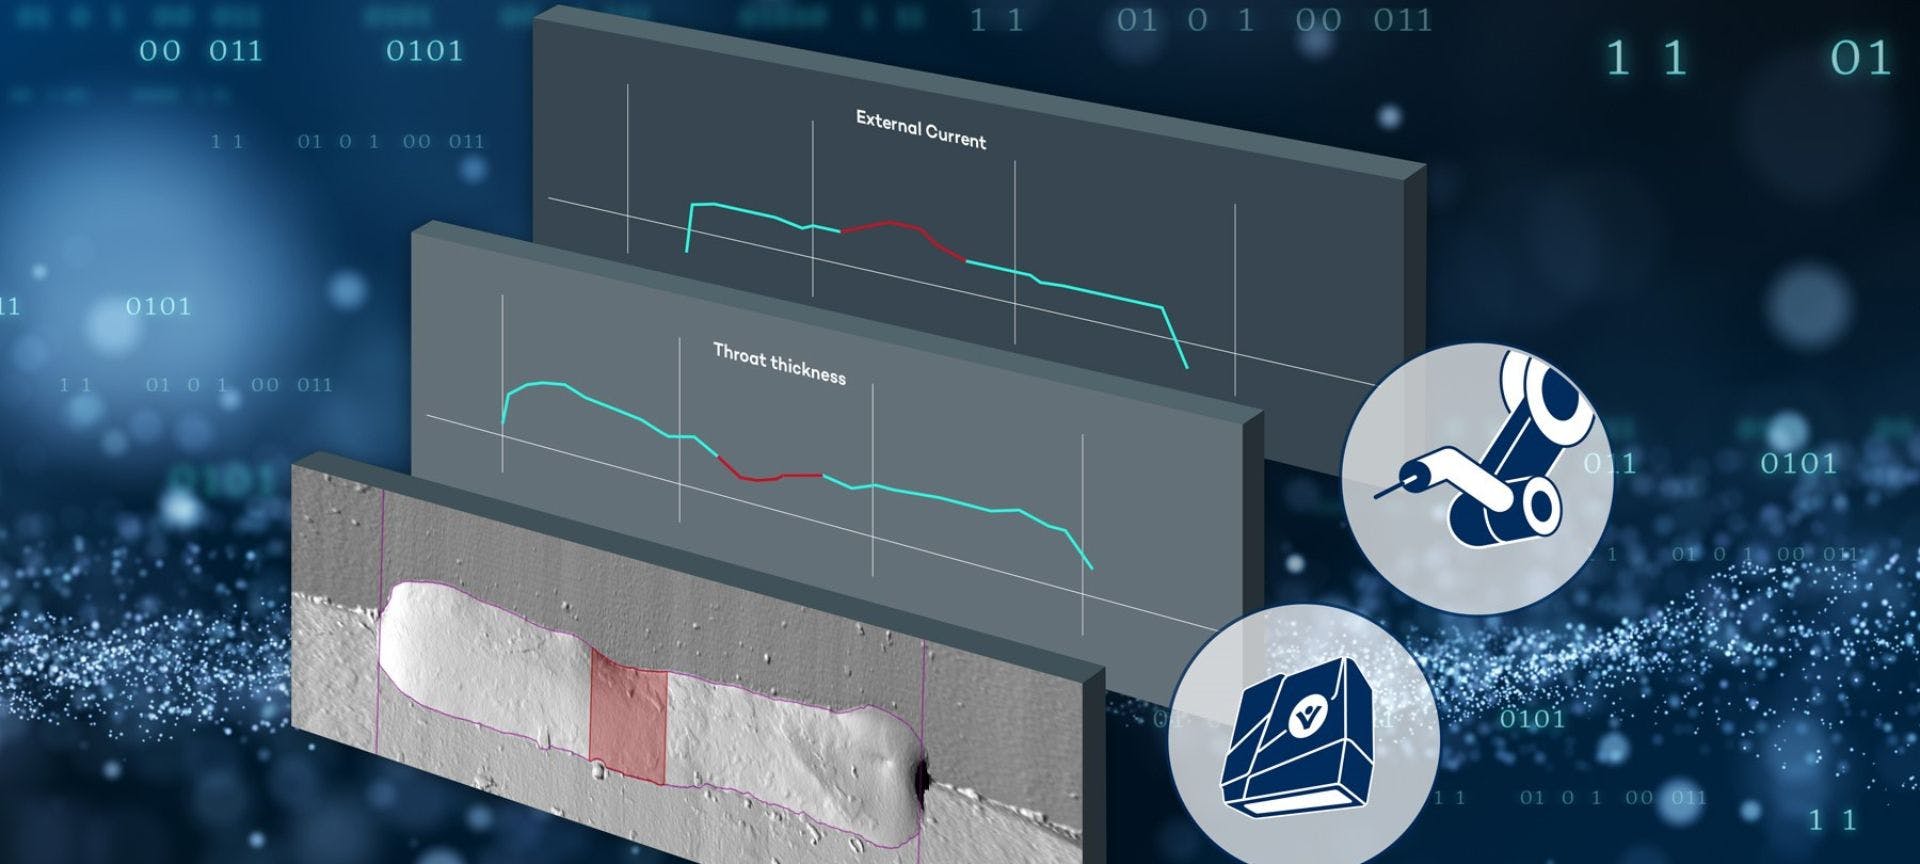
That is why VITRONIC, the Wiesbaden-based specialist for industrial image processing, launched the Weldloop software at the beginning of 2022. Weldloop integrates data from two sources: 3D data from automated weld inspection with VITRONIC VIRO WSI and process data from the welding line in WeldCube Premium, the documentation solution from Austrian manufacturer Fronius. The software maps the image and inspection data with the process data and displays them together. This makes it easier to identify correlations between defective seams and deviations in the welding process.

Up to 6 different process data like voltage, current, wire feed can be evaluated additionally, here exemplary selected the voltage curve for the 3D scan of the seam
Eliminate errors quickly with visual evaluations and integrated solutions
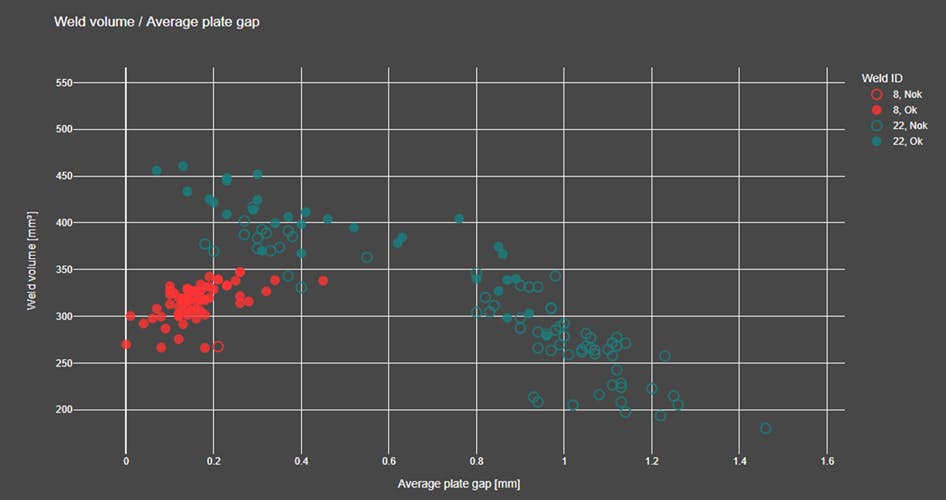
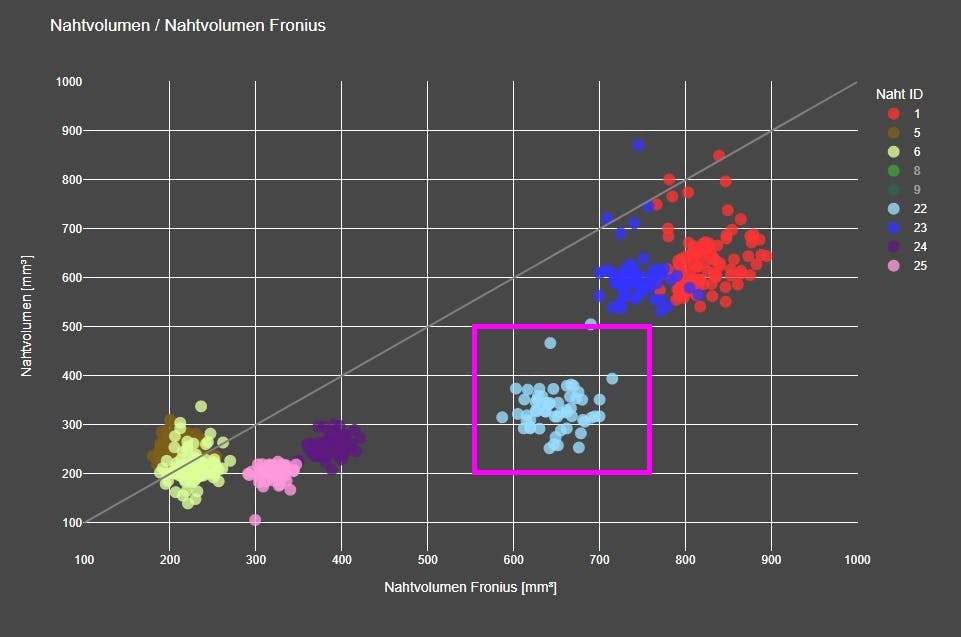
The latest Weldloop version provides a range of new evaluations, visualizations and tools. This makes it faster and easier for welding engineers to analyze defects and eliminate the causes. With visualizations such as scatter plots, large amounts of data can be displayed at once, for example different measured values from several welds in one overview (see visualization).
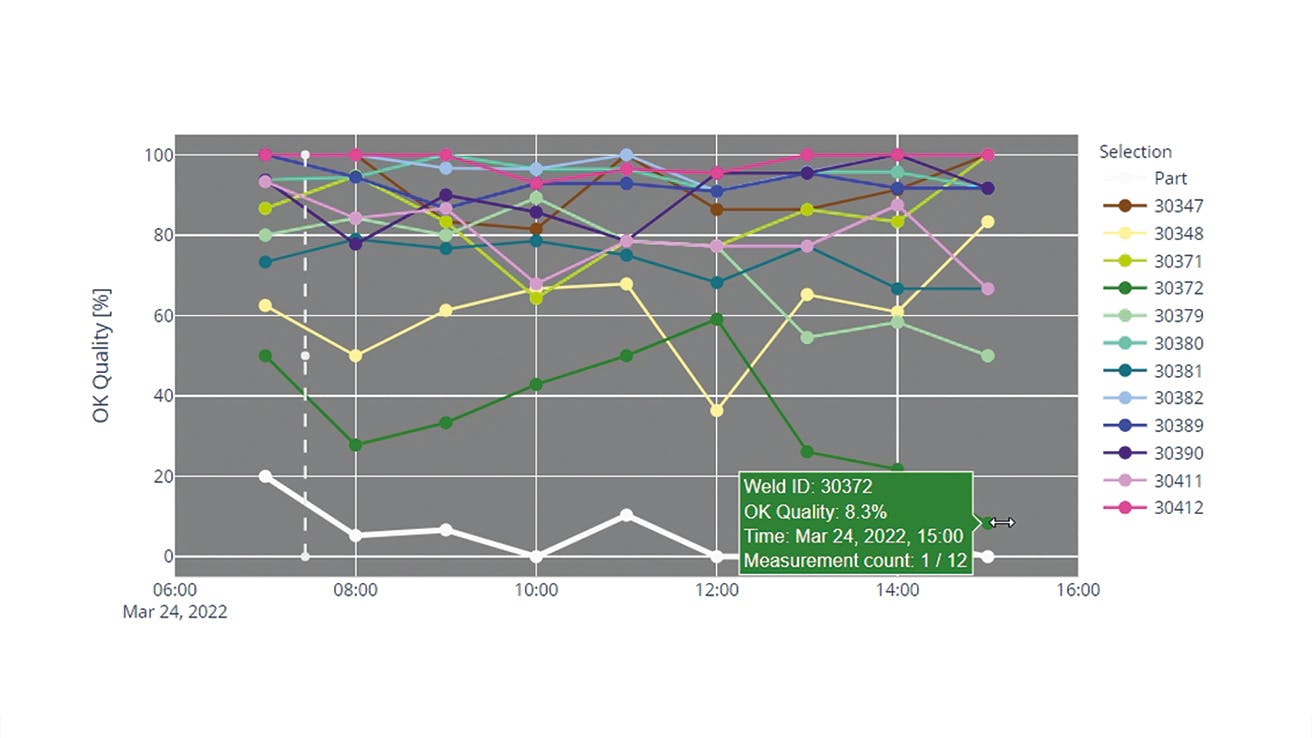
Using trend displays, the quality of a component and individual seams can be tracked over time on an hourly, daily and weekly basis. One click takes you directly to the detailed view with the measured values of individual seams. Causes of errors can be traced back to individual welding stations and exact times.
A few more clicks are all it takes to eliminate the cause: Workers can check in Weldloop whether the process data is within the specified limits and switch directly to Weldcube Premium to optimize the parameters and limits of the welding station. Manual analyses become unnecessary, as do constant changes between different stations and solutions. Weldloop also allows the import of manual defect evaluations by the workers; based on the data, pseudo defects can be minimized and test methods can be optimized.
For documentation, optimization and audits, the software comes with a number of standard interactive reports (see scatter plots). All data can be transferred to external databases for long-term archiving.